Tutorials · English
Skyscraper editorial format · verified 4 November 2026
AI visibility reporting dashboard brief: make change and action visible
A dashboard should help a team decide what to do next. Define the scope, evidence and action owner before adding another chart.
Key takeaways
How to brief an AI visibility reporting dashboard that supports decisions.
- How to brief an AI visibility reporting dashboard that supports decisions.
- Define the audience, decisions, question panel, markets, languages and reporting cadence.
- Review dashboard usefulness by actions completed, not by number of widgets.
- A weekly view can show lost citations, affected pages, search impressions and the owner responsible for the recovery test.
- Dashboards cannot replace source evidence.
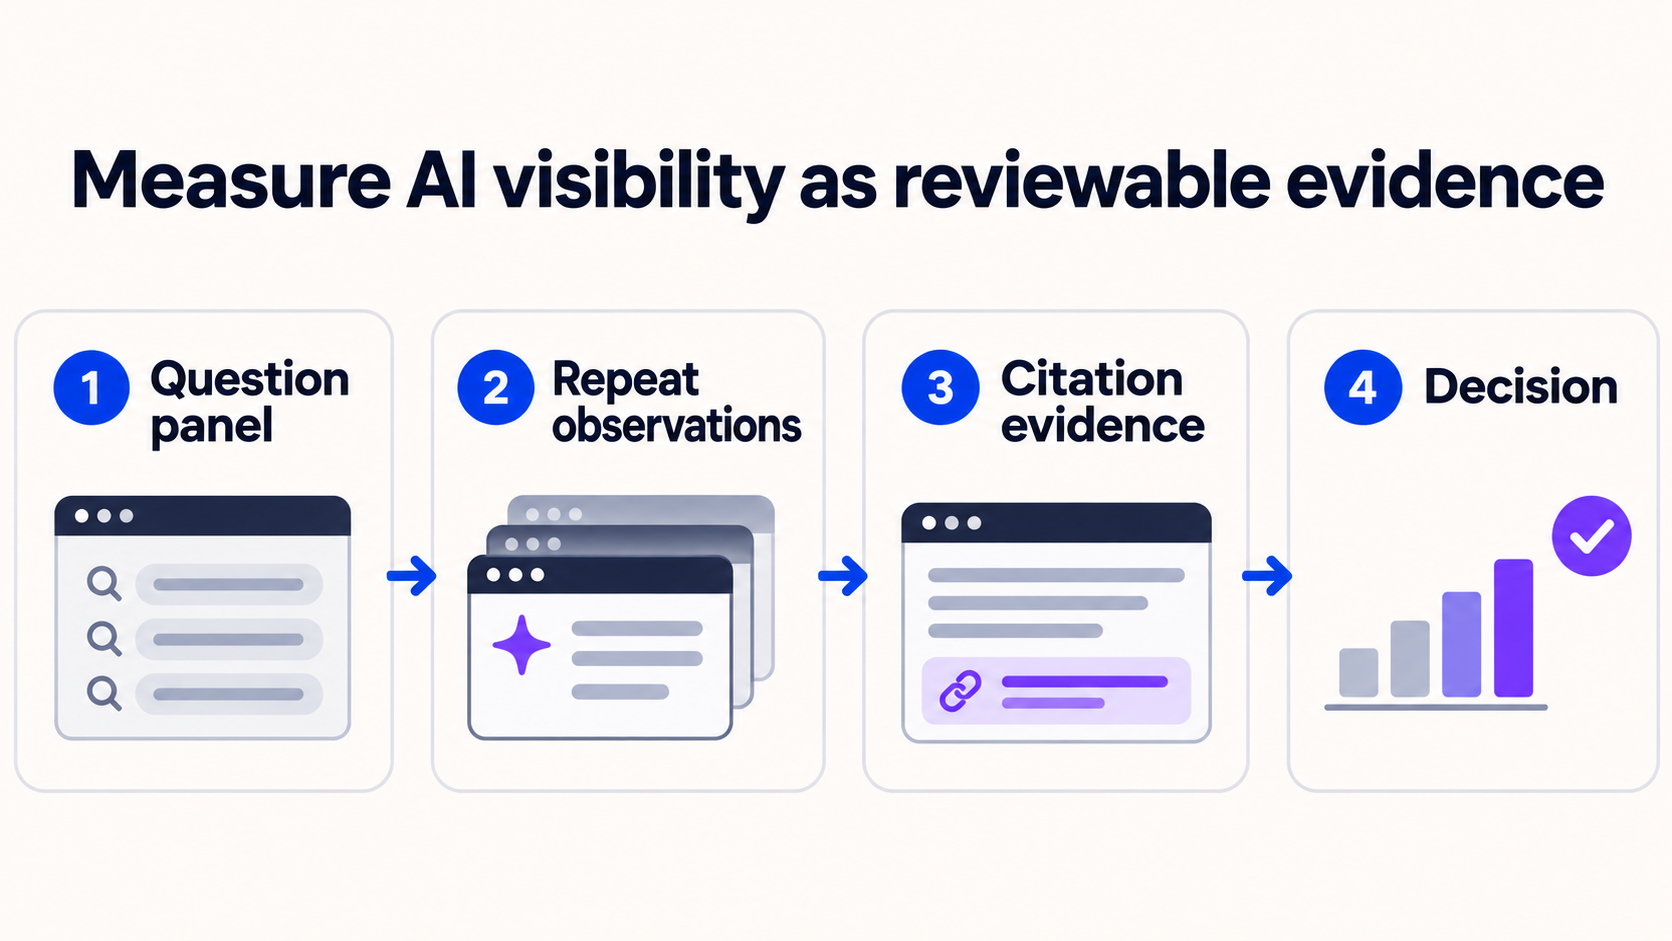
How to brief an AI visibility reporting dashboard that supports decisions.
- 1Define the audience, decisions, question panel, markets, languages and reporting cadence.
- 2Separate visibility, citation, competitor, traffic, conversion and confidence metrics.
- 3Show trend context, evidence links, change notes, alerts and unresolved uncertainty.
- 4Give each material gap an owner, due date, recommended action and success signal.
- 5Review dashboard usefulness by actions completed, not by number of widgets.
A weekly view can show lost citations, affected pages, search impressions and the owner responsible for the recovery test.
Limits
- Dashboards cannot replace source evidence.
- Metric definitions must remain stable across periods.
- Too many KPIs can hide the action priority.
How to interpret the result
AI visibility reporting dashboard brief: make change and action visible. This is a decision workflow, not a checklist of isolated settings. Read each observation against the original question, the public output and the expected user or crawler behaviour.
Interpret the observation in context
How to brief an AI visibility reporting dashboard that supports decisions. Start with the exact scope, then compare the observed value with the expected value. A green status can confirm one technical observation while leaving indexation, ranking or conversion unanswered.
Context before conclusion
A weekly view can show lost citations, affected pages, search impressions and the owner responsible for the recovery test.
A practical operating note
Use this as a decision record: define the question, inspect the live output, make one controlled change, and recheck the same evidence. That sequence keeps diagnosis separate from assumptions. Make the smallest reversible change possible and keep the previous value. This protects the page from accidental regressions and gives another specialist enough context to reproduce the review.
Quality gate
Dashboards cannot replace source evidence.
What to measure next
Record the exact URL or property, the date, the tool state and the visible output. Repeat the same check after the change and compare like-for-like values instead of relying on a single screenshot.
Next observation
Review dashboard usefulness by actions completed, not by number of widgets. Keep the result separate from traffic, ranking and revenue claims until those outcomes are measured in their own systems.
The step-by-step workflow
Use this as a decision record: define the question, inspect the live output, make one controlled change, and recheck the same evidence. That sequence keeps diagnosis separate from assumptions.
Define the audience, decisions, question panel, markets, languages and reporting cadence.
Why it matters
Start by writing down the exact question and scope. A precise question prevents the workflow from drifting into unrelated checks.
Separate visibility, citation, competitor, traffic, conversion and confidence metrics.
Why it matters
Validate the live output before editing anything. This creates a baseline and separates a real defect from a reporting delay.
Show trend context, evidence links, change notes, alerts and unresolved uncertainty.
Why it matters
Check the surrounding signals that can explain the observation. Compare like-for-like values instead of relying on one screenshot or status label.
Give each material gap an owner, due date, recommended action and success signal.
Why it matters
Change one variable at a time and record what changed. Controlled changes make the next observation attributable and reversible.
Review dashboard usefulness by actions completed, not by number of widgets.
Why it matters
Recheck the same evidence after the change. Record the timestamp and outcome so the result can be reviewed later.
Intent
Evidence
Controlled change
Recheck
Evidence and implementation notes
A weekly view can show lost citations, affected pages, search impressions and the owner responsible for the recovery test.
Capture the exact URL or property, timestamp, expected state and observed result. Keeping those fields together makes the work reproducible and easier to hand off.
intent: How to brief an AI visibility reporting dashboard that supports decisions.
language: en
evidence: official-tool workflow + local QA
status: reviewable tutorial| Check | What to capture | Why it matters |
|---|---|---|
| 1. Define the audience, decisions, question panel, markets, languages and reporting cadence. | Exact value, URL, timestamp and visible status. | Preserves a reviewable baseline before and after a change. |
| 2. Separate visibility, citation, competitor, traffic, conversion and confidence metrics. | Exact value, URL, timestamp and visible status. | Preserves a reviewable baseline before and after a change. |
| 3. Show trend context, evidence links, change notes, alerts and unresolved uncertainty. | Exact value, URL, timestamp and visible status. | Preserves a reviewable baseline before and after a change. |
| 4. Give each material gap an owner, due date, recommended action and success signal. | Exact value, URL, timestamp and visible status. | Preserves a reviewable baseline before and after a change. |
| 5. Review dashboard usefulness by actions completed, not by number of widgets. | Exact value, URL, timestamp and visible status. | Preserves a reviewable baseline before and after a change. |
Common mistakes to avoid
The most expensive errors come from changing several variables at once or treating a tool status as a business outcome. Use each limitation below as a quality gate before publishing a conclusion.
1. Quality gate
Dashboards cannot replace source evidence.
2. Quality gate
Metric definitions must remain stable across periods.
3. Quality gate
Too many KPIs can hide the action priority.
Frequently asked questions
What is the fastest safe way to start?
Use this as a decision record: define the question, inspect the live output, make one controlled change, and recheck the same evidence. That sequence keeps diagnosis separate from assumptions. Define the audience, decisions, question panel, markets, languages and reporting cadence.
Does a successful check guarantee a business result?
A weekly view can show lost citations, affected pages, search impressions and the owner responsible for the recovery test. Dashboards cannot replace source evidence.
What should I record for a repeatable review?
Capture the exact URL or property, timestamp, expected state and observed result. Keeping those fields together makes the work reproducible and easier to hand off. Review dashboard usefulness by actions completed, not by number of widgets.
Talk to an expert
Want this workflow applied to your site? Talk to a ViziGEO expert for a practical next step and a reviewable evidence baseline.